
After five busts in a row, the big multiplier is not "due"
For press and research
"Easy money" videos around crash games all sell the same mechanism: after a run of low rounds, the big multiplier is supposed to be "due" — you just have to wait for the streak, then bet. We tested that promise on the published million rounds of our simulation of the documented model of these games: the full streak ladder (1 to 5 low rounds, two thresholds), the real waiting times for big multipliers, and a complete replay of the "wait, then bet" tactic against a control that bets every round. The figures' verdict: the streak changes nothing about the next round — and waiting costs the same price, or more, per bet.
- After 5 consecutive rounds below 1.50x (5,192 occurrences), the next round reaches 10x or more in 9.958% of cases — against 9.804% in ordinary times (standard error: 0.42 points): no measurable effect, at any streak length.
- The real wait for a multiplier of 100x or more — the one in the screenshots — is 71 rounds at the median and 476 rounds at the 99th percentile; in 37.83% of 100-round blocks, none appears at all.
- Tactic replay: waiting for 3 low rounds then betting loses 27.50 units per 1,000 bets; waiting for 5 low rounds loses 35.36 — against 23.95 for the control that bets every round. Waiting reduces exposure, never the price per bet.
- Public methodology (formula, parameters, seed): these are rounds simulated from the documented model, not rounds measured at an operator. 18+ study, with no promise of winnings.
The complete figures of this study are attached to this page, as a free download.
Key takeaways
- This page measures whether a run of low rounds makes a big multiplier more likely — the promise at the heart of "easy money" videos and "predictor" content.
- The reader finds the measured answer — no —, the real waiting times for big multipliers, and the exact cost, per bet, of the "wait for the streak, then bet" tactic.
- After 5 rounds below 1.50x, the next reaches 10x in 9.958% of cases, against 9.804% in ordinary times; the median wait for a 100x is 71 rounds.
- Every figure comes from the million simulated rounds we published, with the data files as free downloads on this page.
- 18+ — risk of financial loss and addiction: set your limits before you play.
| Preceding streak | Occurrences | Next ≥ 2x | Next ≥ 10x | Median next bust |
|---|---|---|---|---|
| None (baseline) | 999,995 | 48.802% | 9.804% | 1.95x |
| 1 low round | 347,853 | 48.850% | 9.819% | 1.95x |
| 3 low rounds | 41,931 | 48.494% | 9.778% | 1.93x |
| 5 low rounds | 5,192 | 47.515% | 9.958% | 1.90x |
What do the "easy money" videos promise?
On 20 October 2026, a thread on the r/ScamCenter forum — "Chicken road to get money very easy is a scam?" — described phone videos and apps promising easy money from Chicken Road; two replies confirmed the scam. It is the third event of its kind logged by our trend watch in six days: on 16 October, a wave of fraudulent clones (fake notifications, impersonation) around the same game; on 18 October, a French-language comment denouncing a "grosse arnaque" around blocked withdrawals. The commercial engine of all three episodes is the same: the easy-money promise. And its playable form — the one "predictor" content sells — is a single mechanic: watch for the low rounds, then place the bet at the moment the big multiplier is supposedly about to "land". In other words, the streak is said to call the jackpot.
That promise is precise, therefore measurable. This page tests its arithmetic — not its popularity, for which no census exists and none is claimed here.[1]
After a run of busts, does the next round pay better?
No. In this study, a round's outcome is its bust multiplier, and a "low" round is one that stops below 1.50x (the 2.00x threshold is published as a sensitivity check in the full file). The documented model of these games — RTP (theoretical return to player, i.e. the share of stakes returned to players over a very large number of rounds) of 98% — draws every round independently of the ones before it: theory therefore predicts the streak changes nothing. The million rounds confirm it, across the whole ladder:
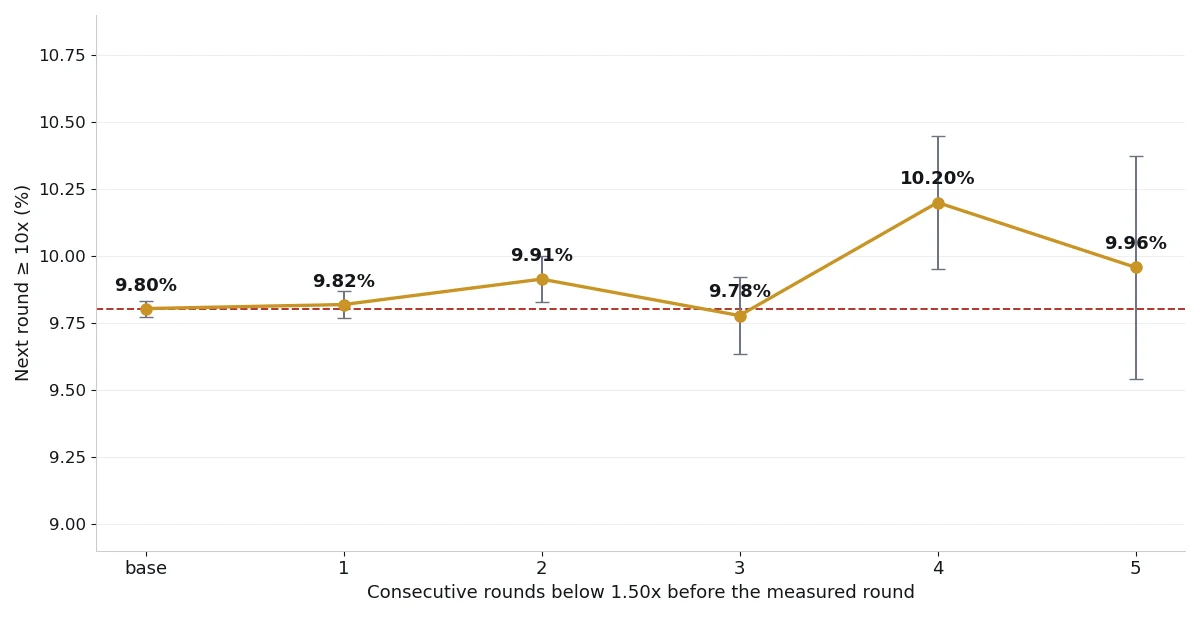
Explore the streak ladder
Switch the target tier and the 'low round' threshold: the bars redraw from the study's published file. Tap or hover a bar for the cell detail.
After 5 low rounds (threshold 1.50x): the next round reaches ≥ 10x in 9.958% of cases — n = 5,192 · standard error 0.42 pts.
Reading: at every streak length — 1, 2, 3, 4 or 5 low rounds, at both thresholds tested — the next round's distribution is the same as in ordinary times, within the sampling error published beside every share in the downloadable file. The round after a long low streak is neither better nor worse: it is new. That is exactly what "independence of rounds" means — and it is the property the "due" promise has to deny in order to exist.[2][3]
How long do you actually wait for a big multiplier?
Longer than the videos show. For a multiplier of 10x or more, the median wait between two occurrences is 7 rounds — but the 99th percentile is 45 rounds, and the longest wait in the million rounds is 118. For a multiplier of 100x or more — the one in the "easy money" videos' screenshots — the median wait rises to 71 rounds, the mean to 102.6, the 90th percentile to 238 and the 99th percentile to 476; the longest observed wait is 912 rounds. And the rarity also reads in blocks: 82.24% of 20-round blocks contain no 100x at all, and neither do 37.83% of 100-round blocks. A player who sits down for 100 rounds therefore has better than a one-in-three chance of never seeing the multiplier the video showed them in ten seconds.[4]
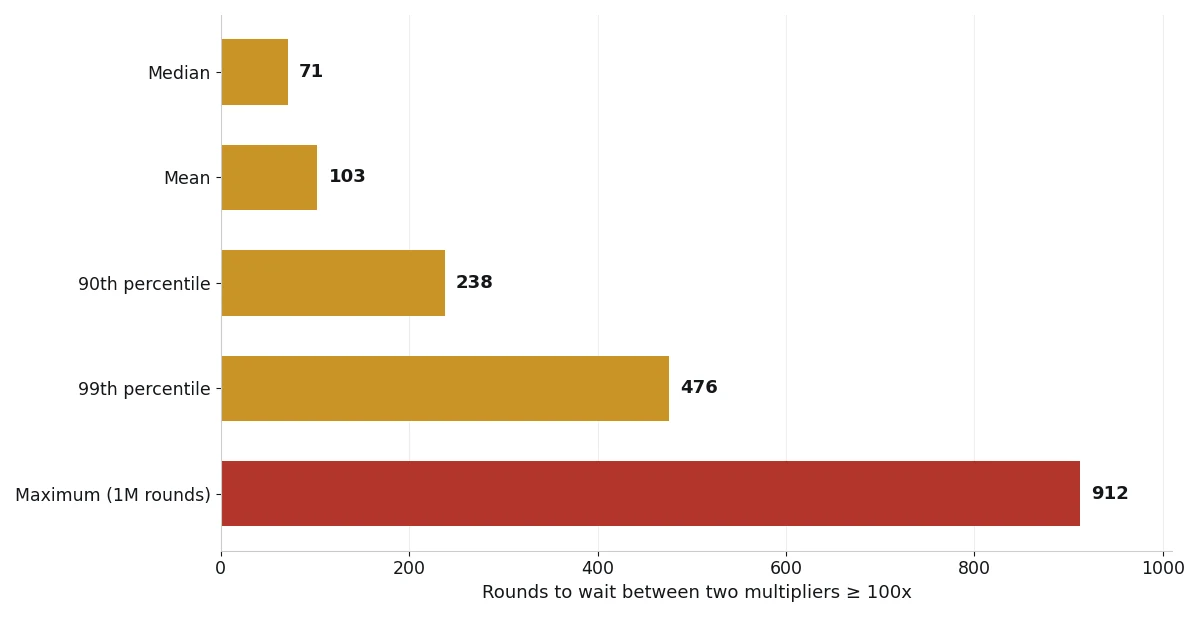
Explore the waiting times
The wait between two occurrences of the chosen tier, across the million rounds. The median is only the middle of the distribution: the 99th percentile tells the rest.
100-round blocks with no ≥ 100x at all: 37.83% · 20-round blocks: 82.24%.
It is this gap — between the multiplier shown and the real wait — that the "due" promise exploits: it presents as a delay to be caught up what is simply the normal shape of a rare distribution.
Wait for the streak, then bet: what does the tactic cost?
We replayed the tactic exactly as it is sold, across the full million rounds: stay out until k consecutive rounds land below 1.50x, then stake 1 unit on the next round only, cashing out at 2.00x — one bet per trigger, the counter reset after every bet. The worked example, broken down: stake 1 unit; if the round reaches 2.00x, the gross return is 2.00 units; otherwise the stake is lost. The control stakes the same unit, at the same cashout, on every round.
| Rule | Bets placed | Rounds won | Net result per 1,000 bets | Net result per 1,000 rounds elapsed |
|---|---|---|---|---|
| Wait for 3 lows, then bet | 27,710 | 48.625% | −27.50 units | −0.76 units |
| Wait for 5 lows, then bet | 3,365 | 48.232% | −35.36 units | −0.12 units |
| Control: bet every round | 1,000,000 | 48.802% | −23.95 units | −23.95 units |
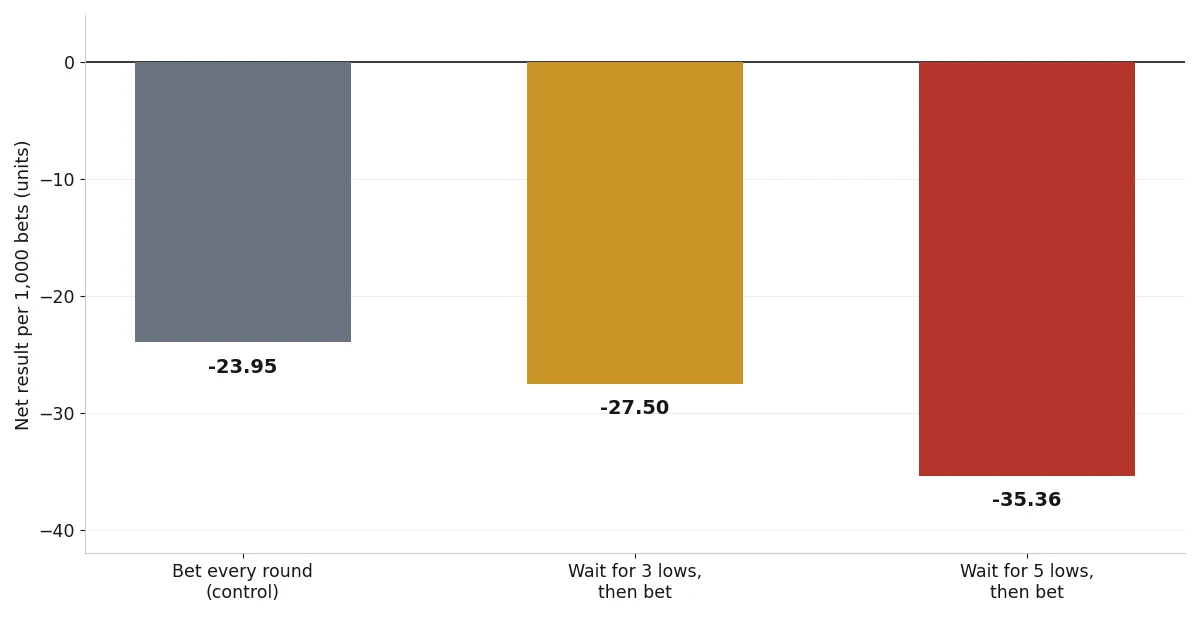
Reading: the tactic loses less in total — because it bets 97% less often. Per bet, it never pays less than the control; in this stream it pays a little more (the small bet counts of the long streaks leave sampling noise visible, and it is flagged as such). Waiting for the streak is exposure reduction, not an edge: the exact kernel of truth inside the videos' pitch — "you lose less" — is true in total and false per bet, and a game's price is read per bet.[4]
The 'due' simulator: test the promise
Set the streak you just watched go by, then your stake. The simulator answers with this study's measured figures — it runs no new simulation.
The published ladder measures streaks up to 5 (5,192 occurrences); beyond that, counts grow too small for a separate cell — the reading therefore uses the streak of 5.
Gap vs baseline: +0.15 pt (standard error of the cell: 0.42 pts).
Wait for a multiplier ≥ 100x: median 71 rounds · 90th percentile 238 rounds. The same after your streak: a wait is never 'caught up'.
What each rule costs — per 1,000 bets of 10 units:
- Wait for 3 lows, then bet−275 units
- Wait for 5 lows, then bet−353.6 units
- Control: bet every round−239.5 units
Your streak matches the replay's 'wait for 5 lows' rule.
Verdict: the streak changes nothing — the next round is new, neither better nor worse. And waiting for the streak costs more per bet than betting every round.
Why does the brain see a multiplier as "due"?
Because the bias is real, documented — and measured in real bettors. It is the gambler's fallacy: the expectation that a run of independent events will "balance out" in the short term. Xu and Harvey (Cognition, 2014) analysed 565,915 real bets from 776 online bettors: after losing streaks, bettors selected ever riskier odds — the mean odds reached 17.07 after six consecutive losses — as if the win had become "due"; for that very reason, they won less often.[5] On the casino floor, Croson and Sundali (Journal of Risk and Uncertainty, 2005), then Sundali and Croson (Judgment and Decision Making, 2006), observe the same mechanism in real staking at roulette and craps.[6][7] The "easy money" videos are therefore not selling a discovery: they monetise a bias the literature has described for twenty years — a bias that acts on the player's decisions, never on the next draw.[5]
What do these figures not say?
Four limits bound every sentence on this page. One: these are rounds simulated from the documented continuous crash model — never rounds measured at an operator. Two: the per-step multiplier ladder of Chicken Road, which its publisher InOut Games does not release, is not modelled — the same limit as our previous studies. Three: the replay prices the game's margin only; a bonus's value, cashback and any named operator's terms do not appear in it. Four: every conditional share carries the standard error published in the downloadable file, and the small cells — the streak of 5, 5,192 occurrences — are read against that error, never as point truths. Finally, there is no followed human case here: no player, no testimonial — only a million rounds, downloadable line by line.
"After five low rounds, the next round reaches 10x in 9.96% of cases — against 9.80% in ordinary times. The streak makes nothing 'due': it only makes the wait longer, and the next bet no cheaper."
— Andrew Dagor, Chicken Road Productions
Available for an interview or a comment on this data: contact the newsroom via the Press page.
Our analysis
Everything above is the result of our published study. What follows is our analysis, and it mixes three things that we distinguish at every step: our published study's findings, credited to it and cited; our calculations on its published tables, flagged as ours, with their margins; and our interpretations, labelled as such. The dividing line here does not run between a regulator and us: it runs between what the study measured and published[4] — the streak ladder, the waiting times, the replay — and the new calculations we draw here from its own tables, notably the check of its waiting times against the geometric law the model implies, which it had not performed.
The measured waiting times are, point by point, those of the geometric law — our check. The model gives P(≥ 100x) = RTP / 100 = 0.98% per round.[2] If every round is independent, the wait between two 100x multipliers follows a geometric law with parameter 0.0098: theoretical median ln(0.5) / ln(1 − 0.0098) ≈ 70.4 rounds, against 71 measured; theoretical mean 1 / 0.0098 ≈ 102.0, against 102.6 measured; theoretical 99th percentile ≈ 468, against 476 measured. And the share of blocks with no 100x at all: (1 − 0.0098)100 ≈ 37.4% in theory for 100-round blocks, against 37.83% measured; (1 − 0.0098)20 ≈ 82.1% for 20-round blocks, against 82.24% measured. The study published the waiting times without confronting them with these values; they agree to within a few rounds, over a million rounds. The study concludes that the game has no memory; our reading, at the scale of the wait: it carries nothing to catch up — every occurrence restarts the same geometric law, and the 71-round median replays in full after each 100x, whether a low streak preceded it or not.[4]
The streak-of-5 gap is worth 0.37 standard errors — our calculation. After 5 low rounds, the measured share of next rounds ≥ 10x is 9.958%, against 9.804% at base: a gap of +0.15 points for a published standard error of 0.42 points, i.e. z ≈ 0.37. The cell's 95% interval, 9.958% ± 1.96 × 0.42, runs from 9.13% to 10.78% and comfortably contains the base. The study called the gap “within the noise”; we put a number on it: for a cell of 5,192 occurrences to establish a real effect of +0.15 points, it would need roughly five times better precision. Our reading: the streak ladder leaves no numerical room for an “almost effect” — the figure most favourable to the “due” promise, taken at face value, sits 0.37 standard deviations from zero.[3][4]
The replay's per-bet surcharge is within the noise too — our re-cut. In the replay, each bet settles at +1 or −1 units (cashout at 2.00x): the net result per 1,000 bets therefore equals 1,000 × (2 × win share − 1), and its standard error follows from the published win share. For “wait for 5 lows”: win share 48.232% over 3,365 bets, standard error ≈ 0.86 points, i.e. ±17.2 units on the result per 1,000 bets — the gap against the control (−35.36 against −23.95, i.e. 11.41 units) is worth z ≈ 0.66. For “wait for 3 lows”: ±6.0 units, and the gap of 3.55 units is worth z ≈ 0.59. The study flagged the noise without quantifying it; our calculation quantifies it: in this stream, waiting costs neither less nor demonstrably more per bet than the control — the per-bet price is the same, to the precision these counts allow. What does change, measurably, is exposure: 3,365 bets per million rounds elapsed, and a total loss, published by the study in its replay file, of about 119 units against 23,950 for the control. The study already said it: waiting is exposure reduction, not an edge. Our reading, presented as such: the tactic is a volume regulator, not a price edge — it decides how many rounds you pay for, never what each round costs.[4]
Sources and methodology
How to read this page: this is independent analysis, published for information. It does not recommend buying, using or avoiding any product, and it is not financial advice. Every figure is computed from data published with this study or from the operator's published terms. We are funded by affiliate commissions disclosed on this site; no operator reviewed or approved this analysis before publication.
References
- Documented promise tested here (logged 20 October 2026): the r/ScamCenter thread “Chicken road to get money very easy is a scam?” describing videos and apps promising easy money from Chicken Road — cited as the source of the tested promise, not as a culprit. ↑
- Scott, Sher & Daigle, "Cash or Crash: Return to Player Percentages and Expected Value of Crash Games", UNLV Gaming Research & Review Journal, vol. 30, February 2026, DOI 10.9741/2327-8455.1509 — source of the distribution model and survival law used here. ↑
- Chicken Road Productions, "Crash game statistics: what 1 million simulated rounds reveal", 2026 — the published dataset (1,000,000 rounds) every figure on this page is drawn from: https://chickenroadproductions.com/en/crash-games-statistics-2026/ ↑
- Chicken Road Productions, "After a Run of Busts, Is the Big Multiplier 'Due'?", 2026 — the study presented on this page: streak ladder, waiting times and tactic replay, with its three CSV files downloadable below. ↑
- Xu, J. & Harvey, N., "Carry on winning: The gamblers' fallacy creates hot hand effects in online gambling", Cognition, vol. 131, 2014, pp. 173–180, DOI 10.1016/j.cognition.2014.01.002 — 565,915 real bets: after losing streaks, bettors select riskier odds. ↑
- Croson, R. & Sundali, J., "The Gambler's Fallacy and the Hot Hand: Empirical Data from Casinos", Journal of Risk and Uncertainty, vol. 30, 2005, DOI 10.1007/s11166-005-1153-2. ↑
- Sundali, J. & Croson, R., "Biases in casino betting: The hot hand and the gambler's fallacy", Judgment and Decision Making, vol. 1, no. 2, 2006, DOI 10.1017/S1930297500000309. ↑
- InOut Games — published RTP value for Chicken Road 1: 98%, the parameter used by this study and by our RTP simulator. ↑
Complete datasets: the streak ladder (11 rows: the next round's conditional shares, standard errors and counts, at both thresholds) — Download the streak-ladder CSV — the waiting times (gaps between multipliers ≥ 10x and ≥ 100x: median, mean, percentiles, empty blocks) — Download the waiting-times CSV — and the tactic replay (both waiting rules and the control, row by row) — Download the replay CSV.
Free reuse for press and research, with attribution: "Source: Chicken Road Productions, After a Run of Busts, Is the Big Multiplier 'Due'?, 2026" — https://chickenroadproductions.com/en/is-the-big-multiplier-due/
Our other statistics
The foundation: crash game statistics — what 1 million simulated rounds reveal.
The cost of a tactic: the real cost of low cashout — what cashing out at 1.01x–1.10x actually costs.
Frequently asked questions
Does this data come from real games played?
No. These are rounds simulated from the documented crash-game distribution model (the law P(bust ≥ x) = RTP / x, at 98% RTP), not rounds measured at an operator. The full methodology — formula, parameters, seed — is published on this page and the CSV files are downloadable: anyone can verify or reproduce every figure, and the analysis script reproduces its files byte for byte.
After several low rounds, is a big multiplier more likely?
No. The measured share after five straight rounds below 1.50x is 9.958%; the ordinary-times share is 9.804% — a 0.15-point gap against a 0.42-point standard error. Every round is drawn independently: the game has no memory, and no tested streak length (1 to 5, at two thresholds) moves the next round.
Does waiting for low rounds before betting reduce losses?
In total, yes — because you bet far less often. Per bet, no: the tactic loses 27.50 units per 1,000 bets (wait for 3 low rounds) and 35.36 (wait for 5), against 23.95 for the control betting every round at the same 2.00x cashout. Waiting reduces exposure, never the price per bet.
Can I quote or reuse these figures?
Yes, freely: credit Chicken Road Productions, the study's title ("After a Run of Busts, Is the Big Multiplier 'Due'?", 2026) and a link to this page. All three CSVs are downloadable in the section above; for a specific extraction, the newsroom answers via the Press page.